A 56-years old female comes with acute onset retrosternal
chest pain of 6 hours duration along with palpitation, sweating, giddiness and
dyspnoea. She was a known case of diabetes mellitus and hypertension since last
10 years. Her pulse at the time of admission was 68 beats per minutes, blood
pressure 90/60 mmhg. ECG of patient at the time of arrival is shown below
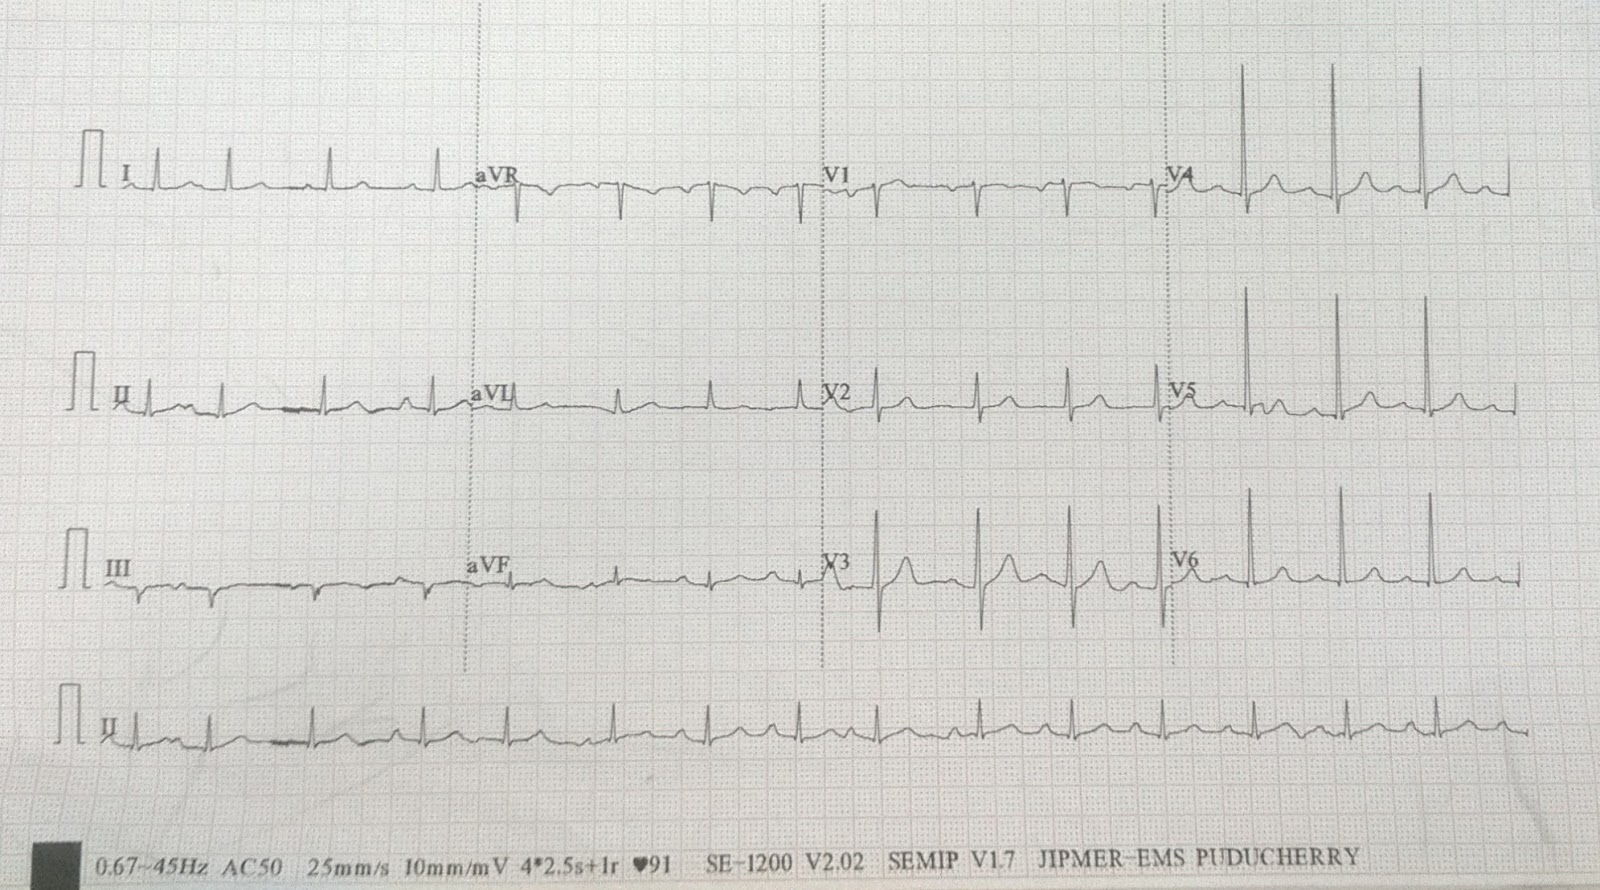
First ECG of the patient

ECG is showing sinus rhythm at 70 beats per minutes, normal axis, there is ST segment elevation in lead II,III, Avf. There is marked ST segment depression in lead I, avL along with T wave inversion in lead avL Lead V1,V2,V3 is showing ST segment depression with ST segment flattening along with upright tall T wave (most prominent in lead V2), ratio of R wave / S wave in lead V2 is more than 1. So the ecg is suggestive of acute inferior wall myocardial infarction along with posterior wall myocardial infarction.
ECG with posterior lead (Posterior lead indicated by lead
V4,V5,V6)

ECG is showing ST segment elevation in lead
V4,V5,V6(representing posterior lead V7,V8,V9)
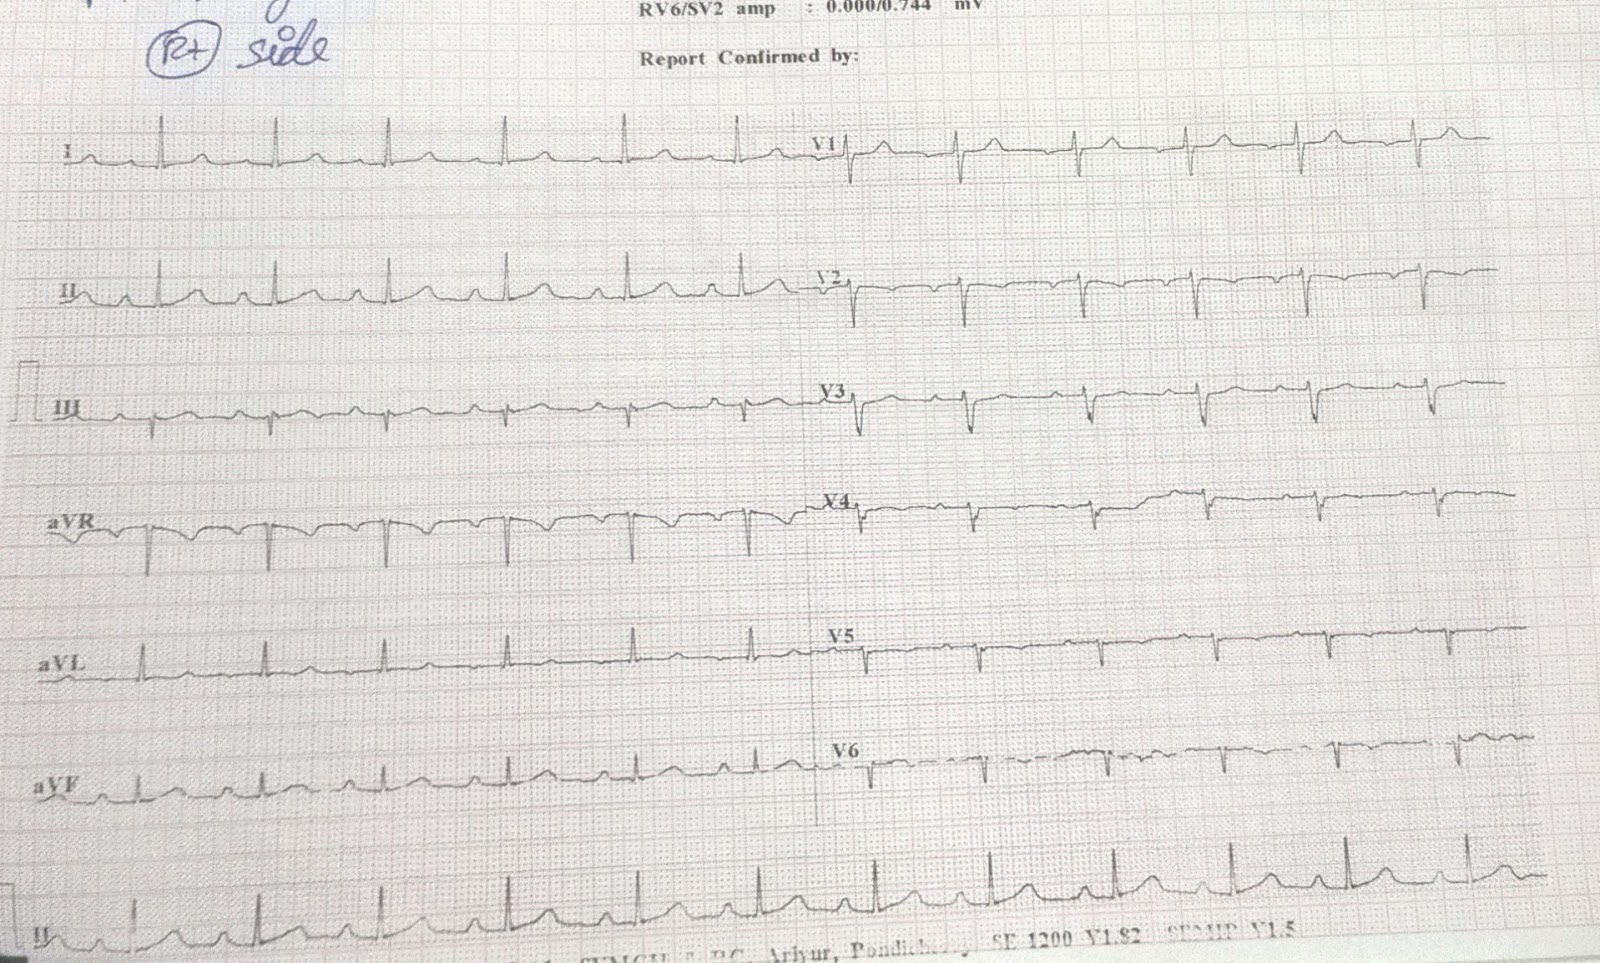
ECG with right sided lead (represented by lead V4,V5,V6)

ECG is showing ST segment elevation in lead V4,V5,V6
Patient was started on thrombolysis. ECG done 30 min after
starting thrombolysis

ECG done 6 hours after thrombolysis

There is significant ST segment resolution after thrombolysis ( more than 50% ST segment resolution suggestive of successful thrombolysis.
Little about ECG finding in posterior wall myocardial infarction
Posterior wall myocardial infarction (MI) occur due to occlusion of either the left circumflex or the right coronary artery. It most commonly occur with acute inferior or lateral MI; but isolated posterior wall MI can occur.
Electrocardiographic abnormalities suggestive of acute posterior wall MI include (in leads V1, V2, or V3):
(1) Horizontal ST segment depression
(2) Tall, upright T wave;
(3) Tall, wide R wave
(4) R/S wave ratio greater than 1.0 (in lead V2 only).
Combination of horizontal ST segment depression with an upright T wave increased the diagnostic accuracy of these two separate electrocardiographic findings.
The additional-lead electrocardiogram using left posterior thorax leads is potentially helpful; ST segment elevation greater than 1 mm in this distribution suggests an acute posterior wall MI
Reference
Brady WJ. Acute posterior wall myocardial infarction: electrocardiographic manifestations. The American journal of emergency medicine. 1998 Jul 1;16(4):409-13.
Thank you.